The MyTime Dashboard was designed to provide access to your most important metrics for operating and growing your business, right at your fingertips. Based on your feedback, we have added additional tabs that display metrics for revenue, payments, bookings, service purchases, product purchases, clients, and productivity. You can filter the dashboard report by a specific location, staff, and date range. You can also choose to view the report to include all tickets or only closed tickets.
Things to know:
- The ability to view the Dashboard Charts is controlled by the "Accessing Dashboard" setting within your access control configuration.
- If your business does not utilize our Point of Sale (POS) system, the following elements will not be displayed:
- The Payment and Products tabs.
- The 'Revenue per Ticket' chart, found on the Revenue and Productivity tabs.
- The Revenue at Time of Purchase/Use filter is only visible when viewing the Revenue tab.
- The Business Snapshot can be exported directly from the Dashboard by clicking the Business Snapshot PDF button located in the top right corner of the charts section.
- Clicking the More Reports button will redirect you to the main Reports page, allowing you to access the complete list of available reports.
Contents:
- Filters
- Revenue Tab
- Gross Revenue Calculation
- Payments Tab
- Bookings Tab
- Services Tab
- Products Tab
- Clients Tab
- Productivity Tab
To access your dashboard, log in to your account and navigate to the Dashboard tab

Filters
- Location: The location where the booking or purchase took place.
- Staff: The name of the staff member who performed the appointment/class or made the sale. You can filter by all staff members or specific staff members.
- Date: The date the booking or purchase took place. Click the dropdown menu to choose the date range that you want to analyze. Options:
- Today
- Yesterday
- Tomorrow
- This Month
- Last Month
- Last 7 Days
- Next 7 Days
- Last 30 Days
- Next 30 Days
- Custom 1 Day
- Custom 7 Days
- Custom Month
Please Note: By default, the date filter is set to the current date. When choosing a custom range, the system automatically calculates the end date based on your selected start date as follows:
- Custom 1 Day: Sets the end date to the same as the start date.
- Custom 7 Days: Sets the end date to 7 days after the start date.
- Custom Month: Sets the end date to the last day of the month selected. For example, selecting August 1st will automatically set the end date to August 31st, while selecting June 1st will set the range through June 30th.
When the closed tickets only toggle is on, only revenue from closed tickets will be reflected (on the date the ticket was closed). When the closed tickets only toggle is off, all revenue will appear on the report, regardless of ticket status. Once you have selected your filters, click on the UPDATE button to generate the desired data.

Revenue Tab
The Revenue tab displays all income generated from sales, breaking down your total earnings per ticket and item type. This allows you to quickly identify which item types are your biggest revenue drivers. When you select the Revenue tab, the following filtering options become available to customize your data view:
- Revenue Logic: Filter by Revenue At Time of Purchase or Revenue At Time of Use to determine how prepaid items are counted.
- Gross/Net Revenue: Base your displayed results on gross or net totals. Note: The Gross/Net selector is a conditional filter.
Gross/Net Revenue Calculation
| Chart | Gross | Net |
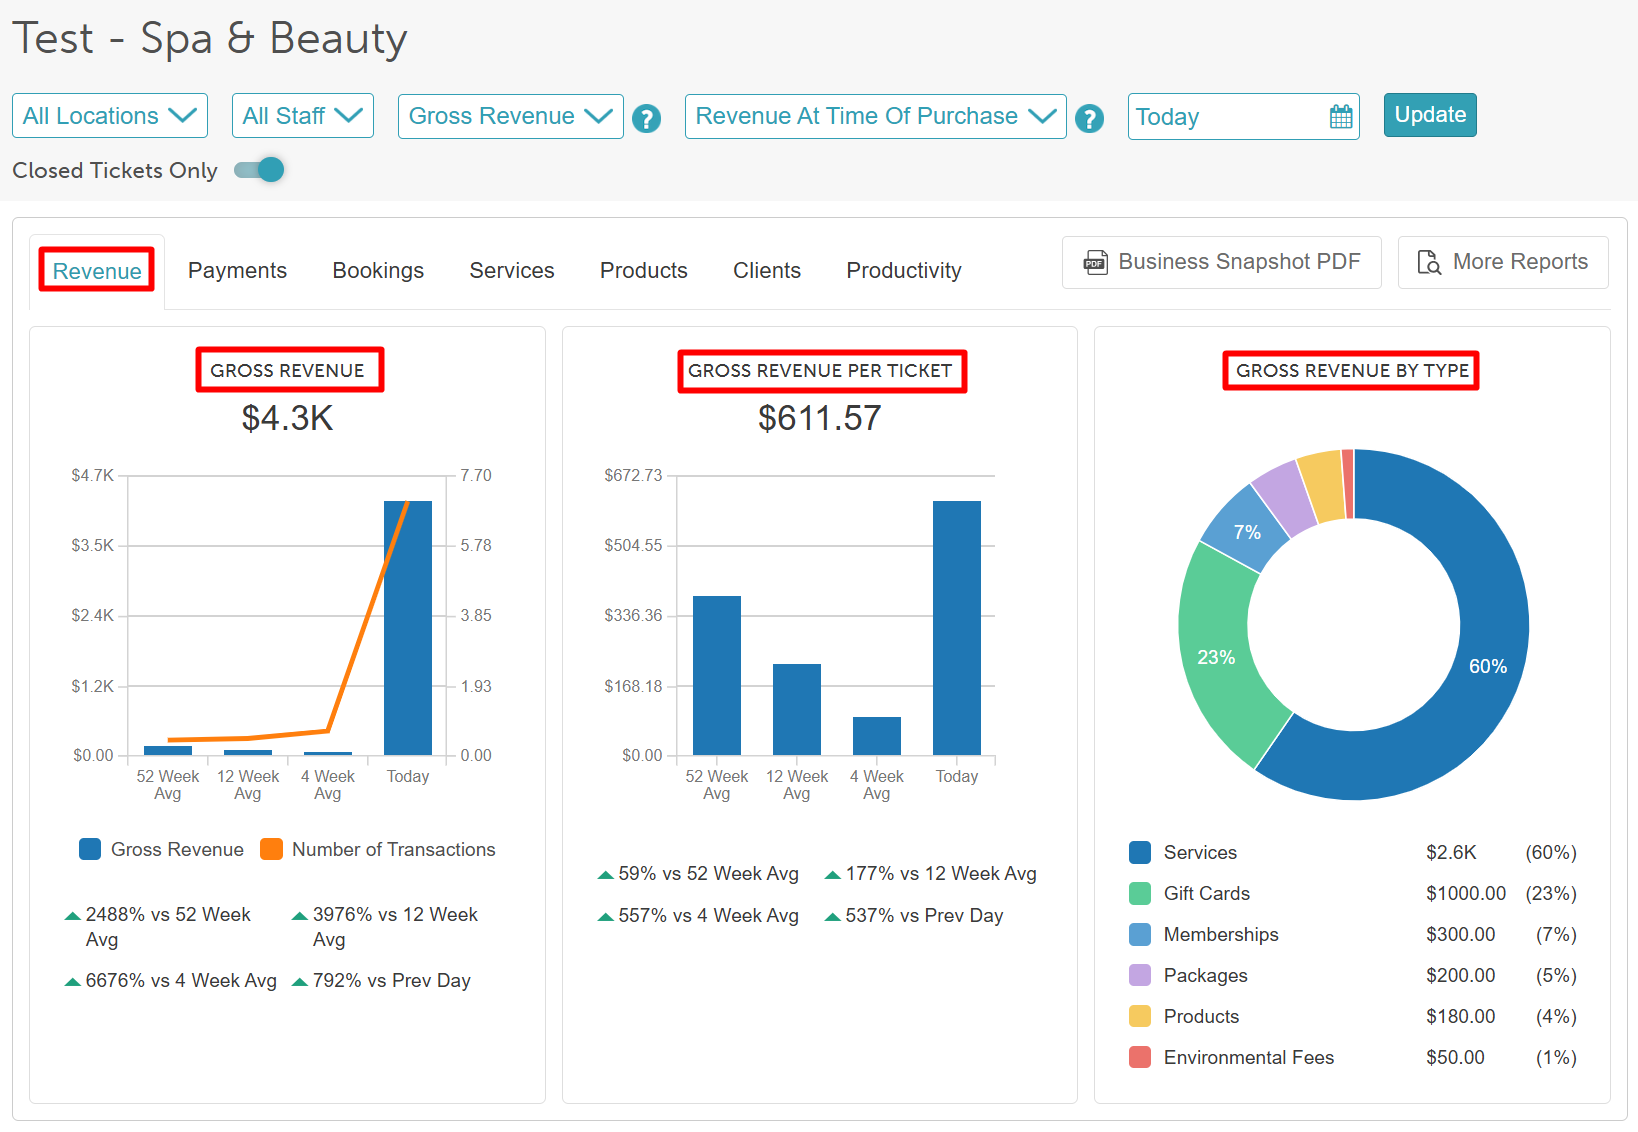
| Revenue | The Gross Revenue metric displays the total revenue generated from services, classes, products, miscellaneous items, cancellation fees, environmental fees, memberships, and package purchases. This data is pulled directly from the Daily Revenue Report and is automatically rounded to the nearest hundred dollars. You can filter these results using two distinct revenue logics:
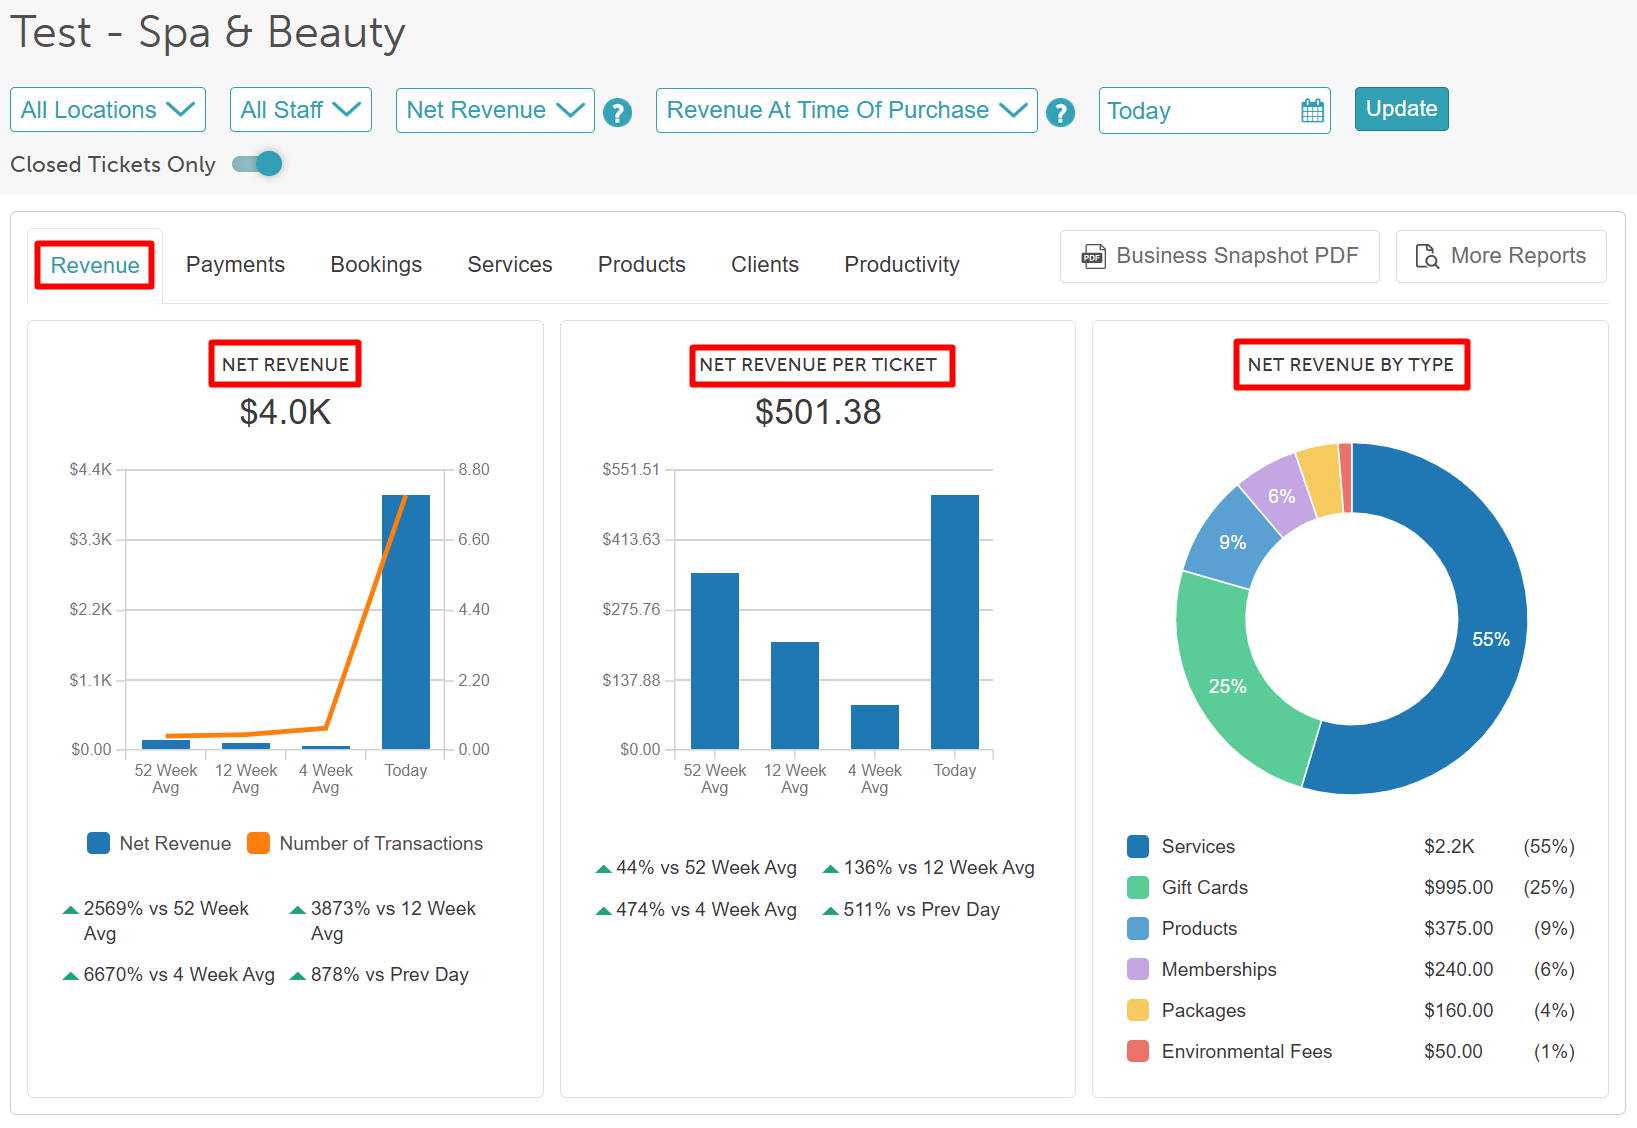
| The Net Revenue metric displays your total revenue from services, classes, products, miscellaneous items, cancellation fees, environmental fees, memberships, and package purchases after deductions are applied. The data is pulled directly from the Daily Revenue Report and is automatically rounded to the nearest hundred dollars. You can filter these results using two distinct revenue logics:
|
| Revenue Per Ticket | This metric calculates the average gross revenue generated per individual transaction. Total Gross Revenue / Total Number of Tickets with Payments: The Total Number of Tickets used in this calculation adjusts dynamically based on your report filters:
| This metric calculates the average net revenue generated per individual transaction, accounting for deductions like discounts and surcharges. Total Net Revenue / Total Number of Tickets with Payments: The Total Number of Tickets used in this calculation adjusts dynamically based on your report filters:
|
| Revenue By Type | This metric displays your total gross revenue broken down by specific item categories, allowing you to see exactly where your income is originating.
| This metric displays your total net revenue broken down by specific item categories, giving you a clear view of your actual profitability across different revenue streams.
|
Gross Revenue
Net Revenue
Gross/Net Revenue Recognition
Item | Time of Purchase | Time of Use |
| Service | Recognize at the retail rate | Recognize at the retail rate |
| Product | Recognize at the retail rate | Recognize at the retail rate |
| Class | Recognize at the retail rate | Recognize at the retail rate |
| Gift card | Recognize purchase | No impact on revenue |
| Package | Recognize purchase | No impact on revenue |
Membership | Recognize purchase | No impact on revenue |
| Use of membership service/product/class item credits | Retail revenue recognized from service/product/class | Retail revenue recognized from service/product/class |
| Use of membership service/product/class value credits | Retail revenue recognized from service/product/class | Retail revenue recognized from service/product/class |
| Use of package service/product/class item credits | Retail revenue recognized from service/product/class | Retail revenue recognized from service/product/class |
| Use of gift card service/product/class item credits | Retail revenue recognized from service/product/class | Retail revenue recognized from service/product/class |
| Cancellation fees | Recognize in full | Recognize in full |
| Environmental fees | Recognize in full | Recognize in full |
Payments Tab
The Payments tab provides a breakdown of net payments received by item, ticket, and payment method. It includes taxes, tips, cancellation fees, and environmental fees, while deducting refunds, prepaids, and discounts.
- Payments Received - This shows all transactions broken down by item. Tips and sales tax are included.
- Payment Per Ticket - Total Payments Collected / Total Number of Tickets with Payments. Total Payment Collected can be found on the Daily Payments report. Total Number of tickets takes into consideration closed tickets + open tickets with payments.
- Payment Method - This shows all payments received, broken down by payment method, regardless of whether a register was open at the time the payment was received. The data is taken from the Daily Payments Report.
- The Payments tab in the Dashboard Charts, like the Daily Payments report, displays transactions based on the primary employee assigned to the ticket. If multiple employees worked on the same ticket, all payments, including tips, will be attributed to the primary employee only. Payments cannot be split across multiple staff members in this view. To view a detailed breakdown of revenue or tips for each employee who performed services, use the Revenue or Tips reports, which provide employee-level details.

Bookings Tab
The Bookings tab displays the number of appointments and class enrollments you’ve booked, appointment status, and which sources are driving your revenue.
- Number of Appointments + Classes: The total number of appointments and class enrollments for the date range selected.
- Appointment By Status: Appointment status totals for appointments on schedule.
- Source of Appointments: Displays the booking source of each appointment booked during the date range selected. The data is taken from the Source of Bookings Report.
- Bookings by Day: Displays the number of appointments and class enrollments grouped by day of the week.
- Bookings by Time: Displays the number of appointments and class enrollment start times grouped by the hour of the day.

Services Tab
The Services tab represents only appointments and class enrollments.
- Appointments or Class Enrollments: Displays the number of booked appointments and class enrollments and revenue generated. No shows and cancellations are not included.
- blue bar = number of booked appointments and class enrollments
- orange line = revenue
- Top Categories: Displays the top 5 service and class revenue categories. Takes data from the By Service report.
- Top Services: Displays the top 5 service SKUs and Other.

Products Tab
The Products tab represents only retail product sales. It breaks it down by the number of products sold, category, and top products.
Products Sold: Displays the total number of products sold and revenue based on closed tickets.
- blue bar = number of products sold
- orange line = revenue
Top Categories: Displays the top 5 product revenue categories.
Top Products: Displays the top 5 product SKUs.

Clients Tab
The Clients tab displays the number of new and existing clients serviced by your business in the selected date range as well as their visit frequency.
A 'New' client is one who had their first visit during the date range selected.
An 'Existing' client is one who had their first visit prior to the date range selected.
- Unique Clients: Displays unique client count over time in appointments, classes, and ticket items.
- Client By Type: This shows the breakdown of appointments by new and existing clients. The data is taken from the Client Type report.
- Visit Frequency - Only includes clients who visited more than once; also includes visits that are retail purchases only, such as products, packages, and gift cards. Membership purchases are not included.

Productivity Tab
The Productivity tab displays productivity metrics that are useful in driving performance improvements. It includes calendar utilization, gross revenue per ticket, and per hour.
- Calendar Utilization - Hours Worked / (Hours Available * Bookings Per Time Slot). The data is sourced from the Calendar Utilization Report, but resources are excluded. To align the Calendar Utilization Report with the Dashboard Charts, filter the report to "No Resources."
- Gross Revenue Per Ticket - Only takes into account gross revenue for services and products.
- Total Gross Revenue for Service / Total Number of Tickets with Payments
- green bar = service revenue
- Total Gross Revenue for Product / Total Number of Tickets with Payments
- blue bar = product revenue
- Total Gross Revenue for Service / Total Number of Tickets with Payments
- Gross Revenue Per Hour
- Total Gross Revenue for Service / Available Hours
- green bar = service revenue
- Total Gross Revenue for Product / Available Hours
- blue bar = product revenue
- Total Gross Revenue for Service / Available Hours

For more information, contact us at support@mytime.com.
Related Articles:
- Appointments / Bookings Report
- Appointment History Report
- Service Sales Detail Report
- Classes Report
- By Class Report
- By Day of Week Report
- By Time of Day Report
- By Source of Booking Report
- Daily Revenue Report
- Daily Payments Report
- Product Sales Detail Report
- Product Sales Analysis Report
- By Client Report
- Lapsed Client Report
- Calendar Utilization Reportur
Was this article helpful?
That’s Great!
Thank you for your feedback
Sorry! We couldn't be helpful
Thank you for your feedback
Feedback sent
We appreciate your effort and will try to fix the article